Blog
What’s New in Qlik Cloud – Dec 2023
Christmas has come early with some great features we have been waiting for. Will this enable the remaining QlikView and NPrinting users to migrate to Qlik Cloud? Our data analytics and integration consultants Roger Gray and Mark James elaborate more on the topic in this blog.
>> Read more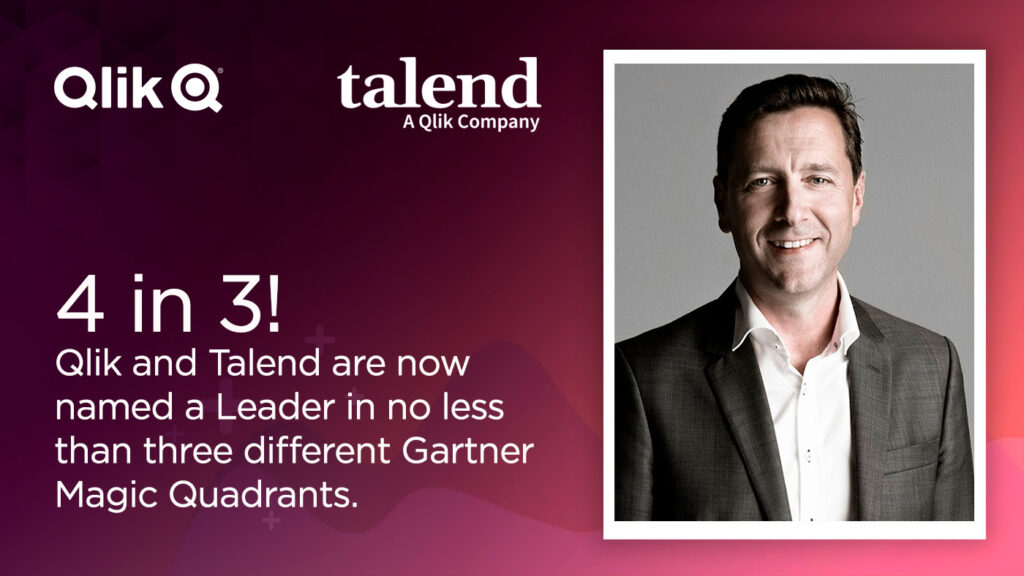
Qlik & Talend now Leaders in three Gartner Magic Quadrants
When Qlik acquired Talend, they reached the unique position of being represented as Leaders in several Gartner Magic Quadrants in the data space. With the latest MQ report for Data Integration Tools, they are the only company named four times as Leaders by Gartner in three different quadrants. How is that even possible? Read how in this blog written by our own Qlik Partner Ambassador, Olof Malmström.
>> Read more
What’s New in Qlik Cloud – Nov 2023
Here we give you the latest and greatest in new features added to the Qlik Cloud platform. It’s now easier than ever to migrate your Qlik Sense apps to Qlik Cloud and to navigate between the Qlik and Talend Clouds if you are an existing Talend customer. Learn more in the blog!
>> Read more
What’s New in Qlik Cloud – Oct 2023
In this blog, Roger Gray and Mark James deep dive into Qlik’s integration with AI technology that can help with the creation of Qlik application expressions and extend data interpretation. Read more about the latest updates added in Qlik Cloud in October.
>> Read more
What’s New in Qlik Cloud – Sep 2023
The latest updates focus on enhancing efficiency, scalability, and governance in data tasks, making Qlik Cloud an ever more powerful tool for organisations to manage their data operations. Let’s dive into the key features and advancements introduced recently.
>> Read more
Qlik Data Integration and Talend
Qlik have acquired Talend, an industry leading Data Management Platform. With Talend, Qlik brings a new approach, offering a full range of best-in-class capabilities, helping customers eliminate technical debt and cost while increasing enterprise confidence that trusted data is available for decision making when it matters most.
>> Read more
Qlik expands its capabilities within Predictive Analytics
Qlik has announced the acquisition of Big Squid, a machine learning platform provider offering no-code automated Machine Learning. Read Climber BI Manager Daniel Häggroth’s reflections about the acquisition and the future for AI and Predictive Analytics.
>> READ BLOG
Exploring the Collaboration and Writeback functionality in Vizlib
The final webinar in our series with Vizlib took place on 15th April. This time we took a closer look at the Collaboration and Writeback Vizlib products for Qlik Sense.
>> Read the summary
Taking a closer look at the Self-Service and Finance Vizlib extensions
The second in our webinar series with Vizlib took place on 25th March. This time we looked at the benefits that the Self-Service and Finance Vizlib extensions can bring to your Qlik Sense applications.
>> Read the summary
Turning Insights to Action with Vizlib extensions
We’re big fans of Vizlib extensions because they add immediate value to Qlik Sense with advanced capabilities, functionality and new chart types. Everything is customisable as you can control every setting and integrate it with your brand or interface with no coding required. If you didn’t catch the first webinar if our series exploring Vizlib value-added extensions, here’s a run-down of what you missed.
>> Read more
Maximise BI value and increase data literacy with the Qlik Usage Monitoring Application
Only 51 % use their Qlik solution on a daily basis, even though 63 % believe that it’s a business critical solution. Providing data is obviously not enough to get your employees on board, and no guarantee that people will actually use BI. So, how do you increase employee engagement?
>> Data literacy is key
Data visualization: choose the right visualization with the help of Qlik
Companies collect a lot of data. Just think of all the information you gather through your website, customer data, geo data, sales data, and so on. In this world of “data madness” we all want to gain important insights in no time. More and more companies are therefore using data visualization in business intelligence tools such as Qlik.
>> How do you choose the optimal visualization to answer your question?
Missing data? Survive Survivorship Bias with Qlik
How come some airplanes don’t return from the battlefield? Are the success stories of Bill Gates, Jeff Bezos and Mark Zuckerberg the best learning experiences? And how could people in 1987 think that cats were more likely to survive if they fell from a higher floor? All these questions have one factor in common: they suffer from “survivorship bias”.
>> What is Survivorship Bias?
Vizlib acquires Climber Extensions
Vizlib, the data visualisation library for Qlik Sense, has today announced the acquisition of Climber Extensions. Providing a range of complementary extensions for Qlik Sense, the spin-off of Climber AB will support Vizlib’s vision of making data talk.
>> Read the announcement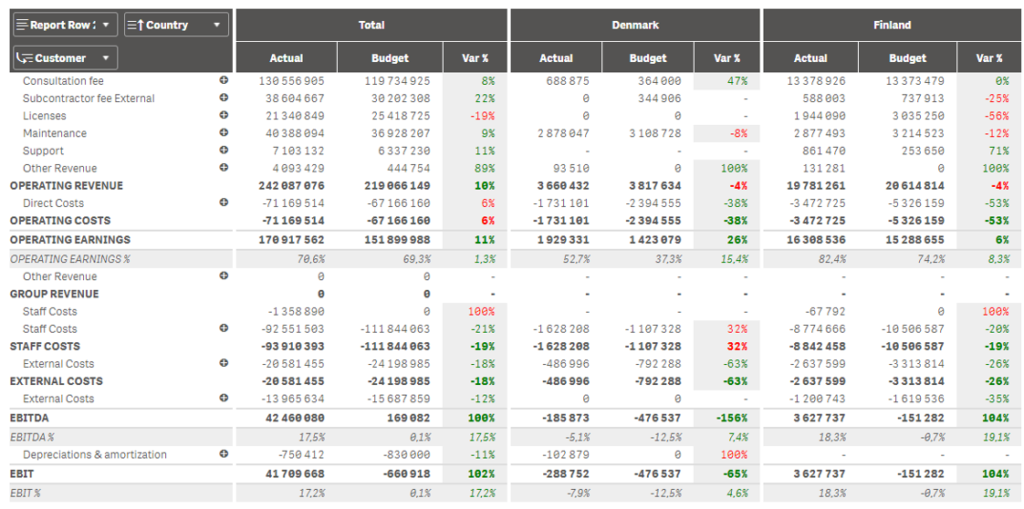
Check out our P&L Extension for Qlik Sense
Finally! Now you can add a P&L to your Qlik Sense solution using the Climber P&L Extension. In this tutorial, we will introduce you to our latest extension, one that makes it easier to connect strategy to your operations.
>> Learn more and watch the tutorial
