Most popular
Qlik a Leader in the 2024 Gartner Magic Quadrant for Data Analytics and Business Intelligence
Get your free copy for an overview of the entire Data Analytics and BI landscape and see why Qlik is recognised as a Leader in the Magic Quadrant for 14 years straight.
>> Download the report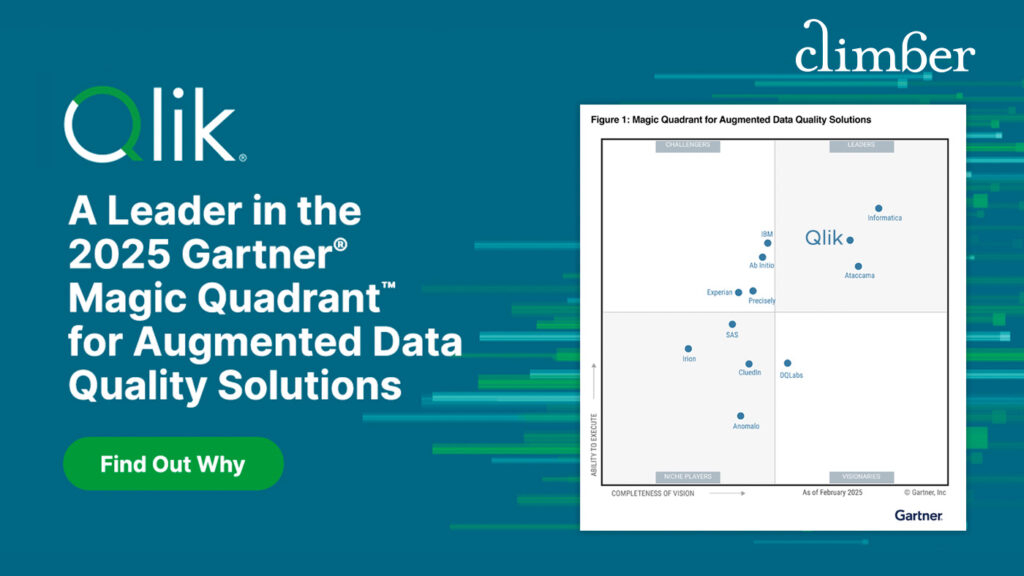
Qlik a Leader in the 2025 Gartner Magic Quadrant for Augmented Data Quality Solutions
Gartner has published the 2025 Magic Quadrant for Augmented Data Quality Solutions. After evaluating 12 top vendors, they have once again named Qlik a Leader—marking the sixth time!
>> Download the report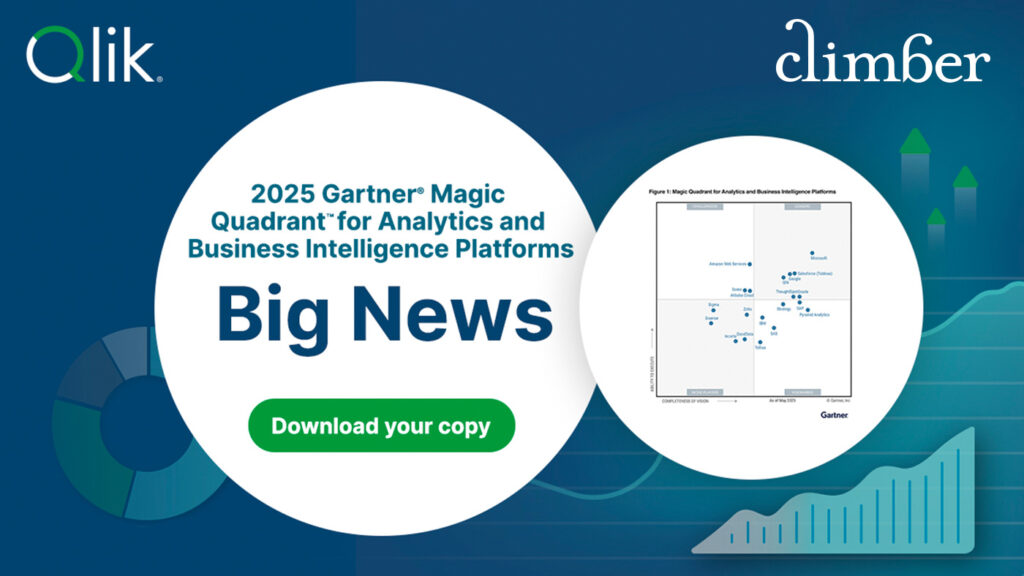
Qlik a Leader in the 2025 Gartner Magic Quadrant for Analytics and Business Intelligence Platforms
Get your free copy for an overview of the entire Analytics and Business Intelligence landscape and see why Gartner has recognised Qlik as a Leader in the Magic Quadrant for the 15th straight year.
>> Download the report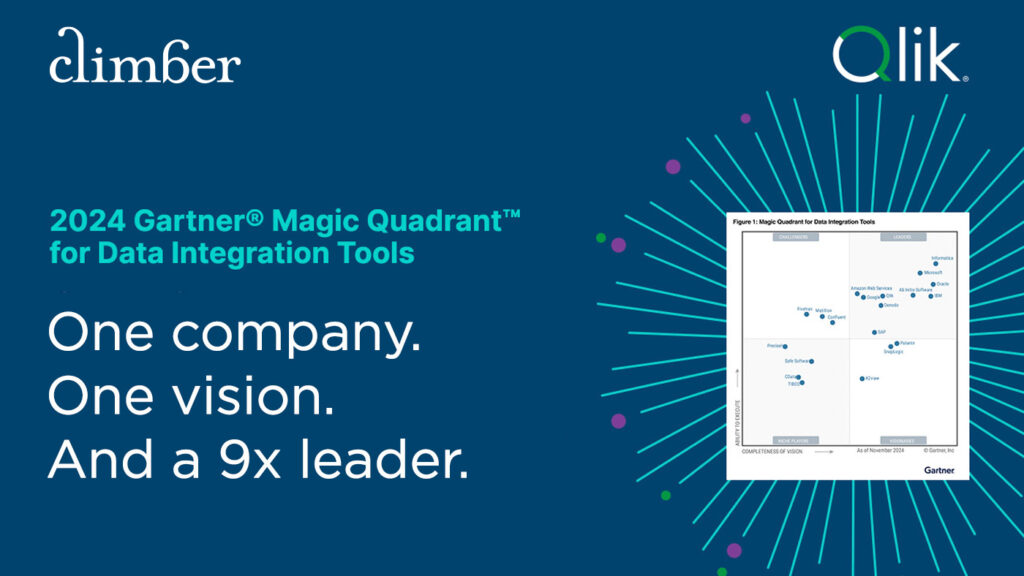
Qlik a Leader in the 2024 Gartner Magic Quadrant for Data Integration Tools
Unsure of how to evaluate the best solution for your needs? Get your free copy of the 2024 Gartner Magic Quadrant report for Data Integration for a quick overview of the landscape and see why Qlik has been named a Leader for the ninth time in a row.
>> Download the report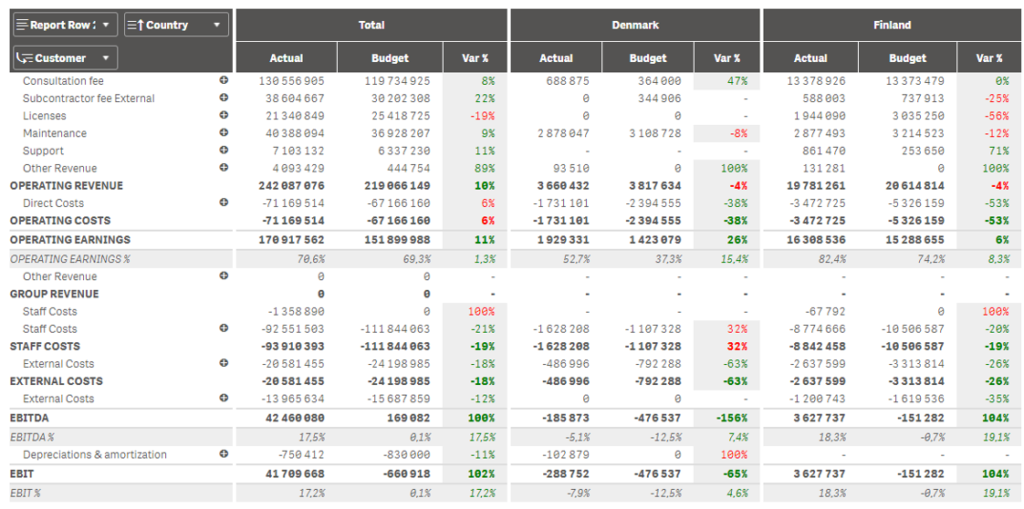
Check out our P&L Extension for Qlik Sense
Finally! Now you can add a P&L to your Qlik Sense solution using the Climber P&L Extension. In this tutorial, we will introduce you to our latest extension, one that makes it easier to connect strategy to your operations.
>> Learn more and watch the tutorial
What was new at Qlik Connect?
A couple of weeks after returning home from Qlik Connect in Orlando, it’s time to summarise all the impressions from the conference. Our BI Manager and Qlik Partner Ambassador Olof Malmström shares the highlights.
>> Read more
Qlik Partner Advisory Council 2025
Qlik has announced their Partner Advisory Council members of 2025! We’re super proud to have our Group CEO Eva Chrona among them, and to have the opportunity to help define the future of data integration and analytics.
>> Read more
Qlik Partner Ambassador 2025
Qlik has announced their Partner Ambassadors of 2025! We’re super proud to have Olof Malmström among them for the fourth consecutive year. Read Olof’s thoughts on the past year.
>> Read more here!
Qlik Partner Ambassadors of 2024
Qlik has announced their Partner Ambassadors of 2024! We’re super proud to have Olof Malmström among them for the third consecutive year. Read Olof’s thoughts on why this is an honorable and important assignment.
>> Read more here!
Qlik & Talend now Leaders in three Gartner Magic Quadrants
When Qlik acquired Talend, they reached the unique position of being represented as Leaders in several Gartner Magic Quadrants in the data space. With the latest MQ report for Data Integration Tools, they are the only company named four times as Leaders by Gartner in three different quadrants. How is that even possible? Read how in this blog written by our own Qlik Partner Ambassador, Olof Malmström.
>> Read more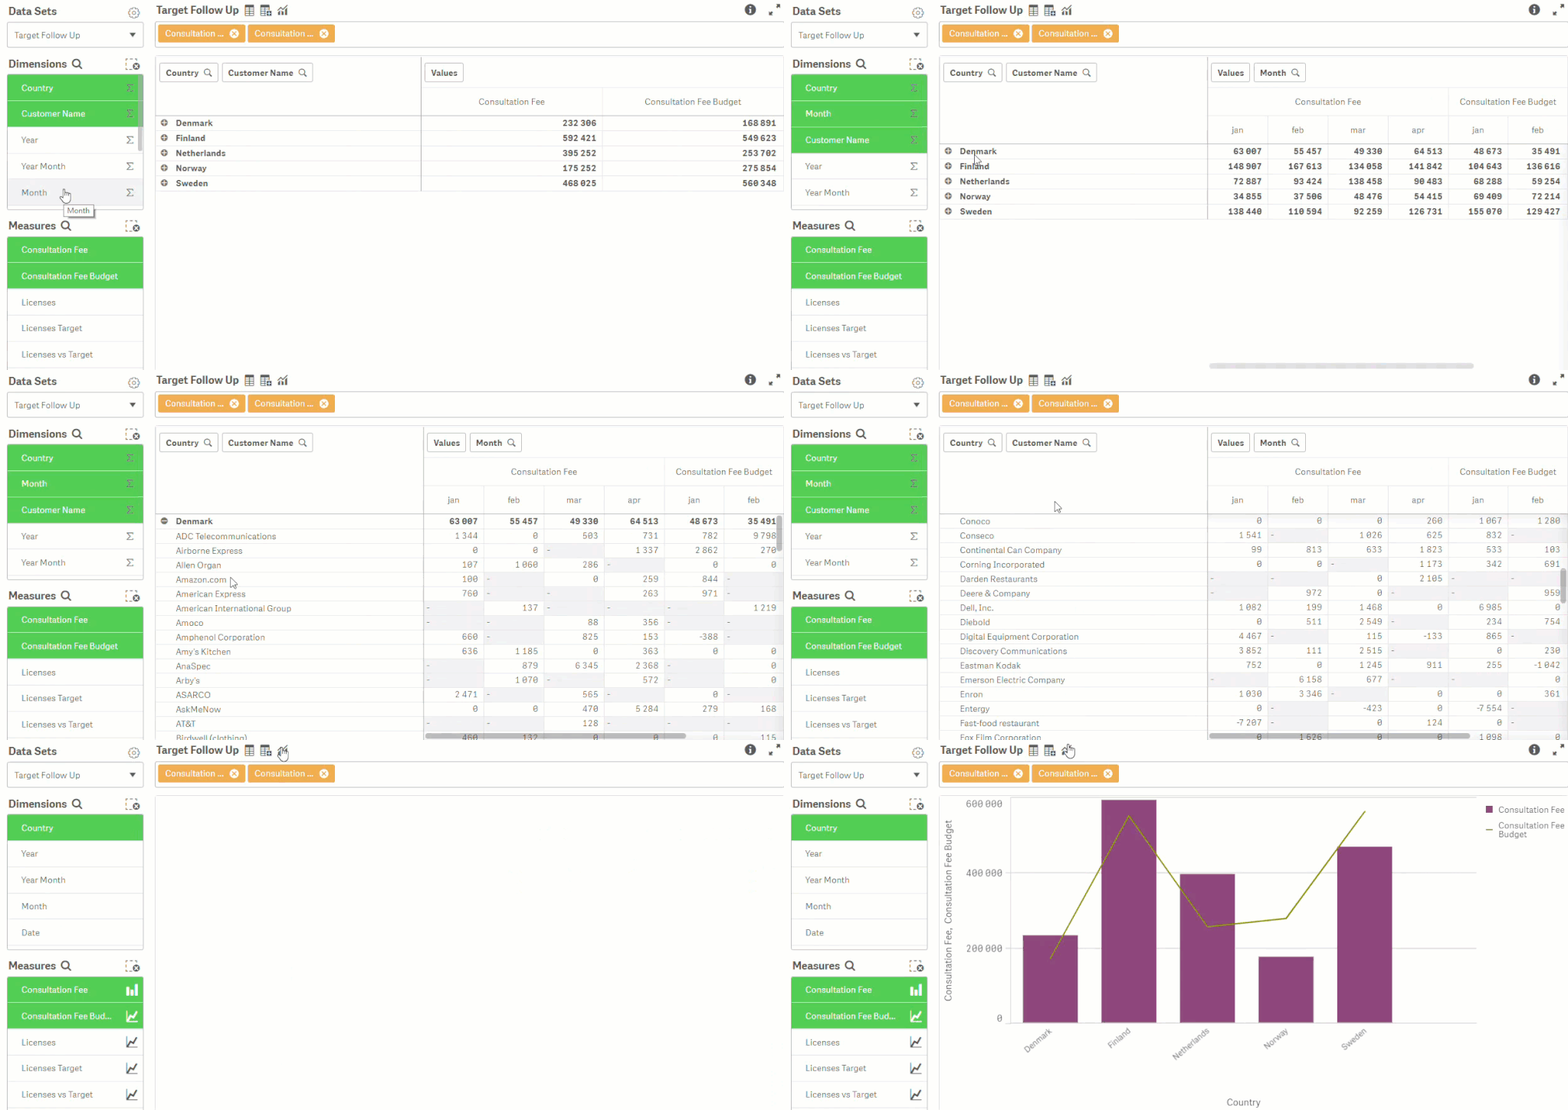
Have you seen the Climber Custom Report for Qlik Sense?
The Custom Report Extension for Qlik Sense is the quintessence of self-service, being able to create customized tables based on data in master tables gives you an extremely versatile and powerful tool. Choose any dimension or measure you want to see and visualize in a variety of ways.
>> Check out the tutorial!
Data Integration Pipeline Build
Join our Data Integration & BI Consultant, Mark James and Qlik’s Global Products Marketing Manager, Adam Mayer, for a live Qlik Cloud Data Integration pipeline build demo.
>> To the webinar!
Drive results in retail with Qlik
Watch our ‘Driving results in retail’ on-demand webinar to learn how Qlik is delivering insights that are informing decision-making and helping to keep stock on the shelves.
>> Watch now!
Qlik is planning to go public again
January 6th, 2022: Our partner Qlik has announced that it’s planning on becoming a publicly traded company once again, six years after it was acquired by private equity firm Thoma Bravo. Qlik has submitted a draft registration with the the U.S. Securities and Exchange Commission related to an initial public offering.
>> Read more
Digia acquires Top of Minds
21 September 2023: Digia reinforces its position as a Northern European Powerhouse in Data Analytics by acquiring Top of Minds, a Swedish IT consulting and service company. Top of Minds has expertise in both modern data analytics and classic data warehousing, front end analytics, and integration – a perfect combination with Climber’s offering.
>> Read more
