Qlik Sense
Qlik Data Analytics Tour International with Climber
Qlik Analytics Tour International with Climber – Predict your way to Action. Join us for a on-demand masterclass on how to accelerate actions through Augmented Data Analytics at the Qlik Analytics Tour 2020!
>> Sign up here!
Active Intelligence is the way to action – QlikWorld 2020 Summary
Today, QlikWorld kicked off and Qlik announced their strategy going forward, sharing their holistic approach including QDI, QDA and data literacy.
>> Get the highlights from the initial 120-minute session!
QlikWorld online 2020
QlikWorld is coming up June 24-25! Join us to take part of what’s in the works regarding Data Analytics, Data Integration and Data Literacy. Get inspired by success stories, enhance your skills with hands-on exercises and be first to check out Qlik’s product news!
>> Sign me up!
The future pitch from Qlik World 2020 Partner Summit
In these uncertain times, speeding up the decision-making process is crucial. During Qlik Virtual Partner Summit they used this momentum to highlight importance of accelerating the time from data to actionable insights.
>> Get our three main takeaways!
Maximise BI value and increase data literacy with the Qlik Usage Monitoring Application
Only 51 % use their Qlik solution on a daily basis, even though 63 % believe that it’s a business critical solution. Providing data is obviously not enough to get your employees on board, and no guarantee that people will actually use BI. So, how do you increase employee engagement?
>> Data literacy is key
Data visualization: choose the right visualization with the help of Qlik
Companies collect a lot of data. Just think of all the information you gather through your website, customer data, geo data, sales data, and so on. In this world of “data madness” we all want to gain important insights in no time. More and more companies are therefore using data visualization in business intelligence tools such as Qlik.
>> How do you choose the optimal visualization to answer your question?
Missing data? Survive Survivorship Bias with Qlik
How come some airplanes don’t return from the battlefield? Are the success stories of Bill Gates, Jeff Bezos and Mark Zuckerberg the best learning experiences? And how could people in 1987 think that cats were more likely to survive if they fell from a higher floor? All these questions have one factor in common: they suffer from “survivorship bias”.
>> What is Survivorship Bias?
Retail Webinar with Qlik’s Jeremy Sim
Sign up for our 45 min on demand webinar with Jeremy Sim, Qlik’s Global Director of Industry Solutions – Retail, on how to be responsive to the changing demands of the consumer.
>> Sign up here!
Vizlib acquires Climber Extensions
Vizlib, the data visualisation library for Qlik Sense, has today announced the acquisition of Climber Extensions. Providing a range of complementary extensions for Qlik Sense, the spin-off of Climber AB will support Vizlib’s vision of making data talk.
>> Read the announcement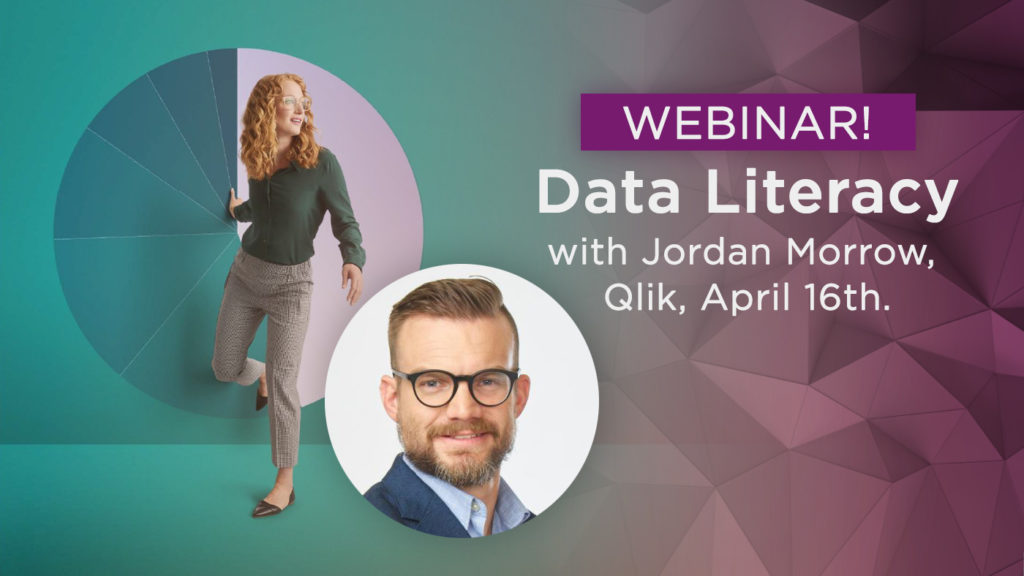
Webinar: Data Literacy crash course with Qlik’s Jordan Morrow
Don’t let data illiteracy hold back on your business performance! Find out how to kick start your journey towards greater data literacy in your organization by joining our 30-minute crash course webinar with Jordan Morrow, Head of Data Literacy, at Qlik.
>> Sign up here!
The Climber Custom Report Extension is TED accredited!
We are very happy to announce that the Climber Custom Report Extension – the quintessence of self-service – for Qlik Sense has been accredited within the Trusted Extension Developer Program. The TED program, that Qlik released a few months ago, enables developers to create innovative extensions that expand the value of Qlik Sense.
>> Read the announcement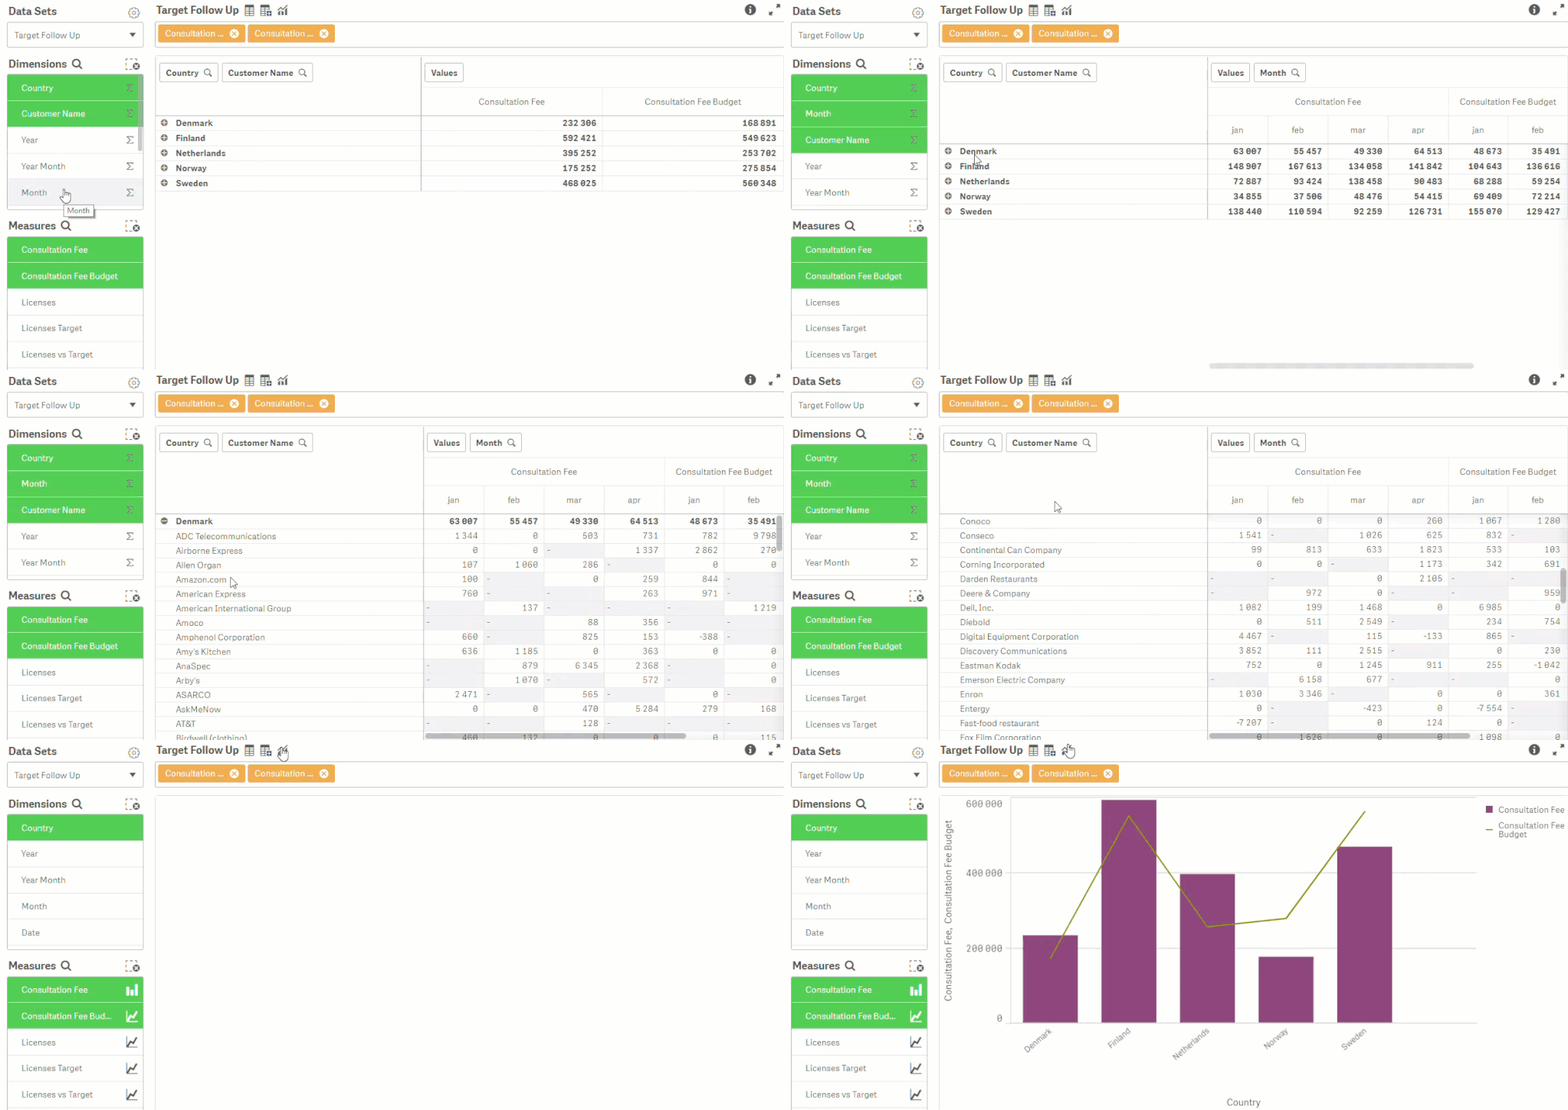
Have you seen the Climber Custom Report for Qlik Sense?
The Custom Report Extension for Qlik Sense is the quintessence of self-service, being able to create customized tables based on data in master tables gives you an extremely versatile and powerful tool. Choose any dimension or measure you want to see and visualize in a variety of ways.
>> Check out the tutorial!
Qlik launches Trusted Extension Developer Program
Qlik today announced the debut of its Trusted Extension Developer (TED) Program, which will enable developers to more easily create and deliver innovative visual extensions into commercial production environments.
>> Read the announcement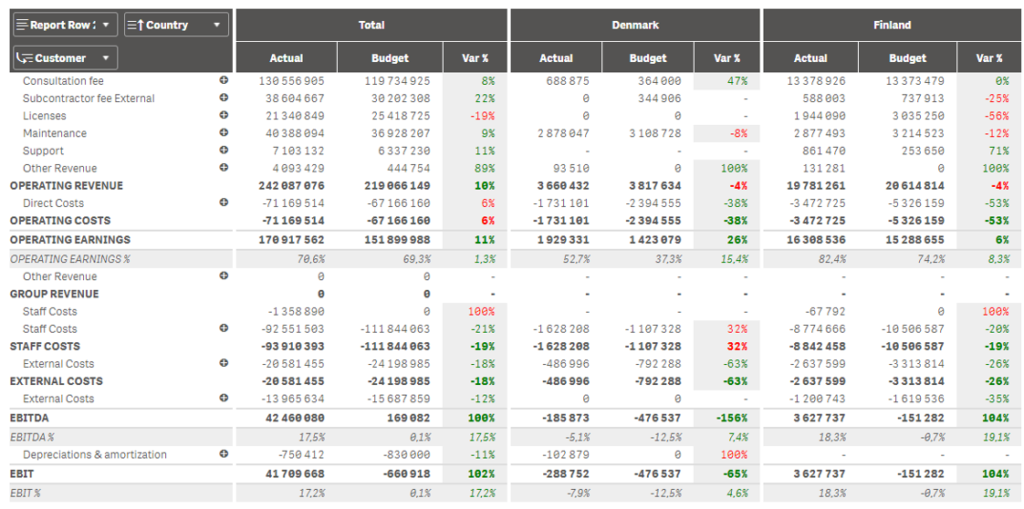
Check out our P&L Extension for Qlik Sense
Finally! Now you can add a P&L to your Qlik Sense solution using the Climber P&L Extension. In this tutorial, we will introduce you to our latest extension, one that makes it easier to connect strategy to your operations.
>> Learn more and watch the tutorial
Climber now Qlik Elite Enterprise Partner across Europe
Climber is excited to announce that we are now a Qlik Elite Enterprise Partner on a European level. Working closely with Qlik since our inception in 2005, our new status is yet another strong argument for companies to turn to us for their Business Intelligence needs.
>>Learn more
